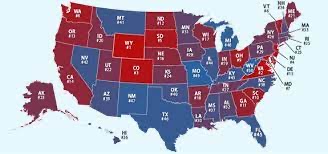
States With The Worst Drivers The number of fatal car accidents is increasing across the country. In 2021, there were over 39,500 fatal car crashes on U.S. roads, marking a 10% rise from the previous year. Certain states exhibit a higher prevalence of dangerous driving, posing increased risks for motorists. We Have conducted a comprehensive comparison of all 50 states and Washington, D.C. using six key metrics to determine which states have the poorest driving records and to gain insight into the specific types of risky driving behaviors in each state.
Outlines Of Guide
ToggleStates With The Worst Drivers
When it comes to driving, not all states are created equal. Some states have a reputation for having the worst drivers in the country. Whether it’s due to aggressive driving habits, a high number of traffic accidents, or a disregard for traffic laws, these states consistently rank at the bottom when it comes to safe and responsible driving. So if you’re planning a road trip, you may want to think twice before venturing into these states with the worst drivers. It’s always important to stay alert and drive defensively, no matter where you are, but it never hurts to be extra cautious in these areas.
Key Takeaways
- Texas tops the list of worst drivers by state, while Washington, D.C., is home to the best drivers in the nation.
- Five of the top 10 states with the worst drivers are in the South, including Texas, Louisiana, Oklahoma, Kentucky and South Carolina.
- Seven of the top 10 states with the best drivers are in the East Coast area, including Washington, D.C., Vermont, Massachusetts, Connecticut, New Hampshire, New York and Rhode Island.
- Montana is home to the most drunk drivers involved in fatal car accidents (19.01 per 100,000 licensed drivers) and New Mexico reports the highest number of fatal car accidents involving a distracted driver (9.54 accidents per 100,000 licensed drivers).
States With The Worst Drivers
Number of Fatal Crashes Per 100,000 Drivers
| 1 | Texas | 100.00 | 1.35 | 1.53 |
|---|---|---|---|---|
| 2 | Louisiana | 89.32 | 0.90 | 0.66 |
| 3 | Kansas | 84.79 | 1.28 | 1.42 |
| 4 | Oklahoma | 80.53 | 0.70 | 0.52 |
| 5 | Kentucky | 78.96 | 0.93 | 0.74 |
| 6 | New Mexico | 78.86 | 0.69 | 0.44 |
| 7 | Wyoming | 78.10 | 2.52 | 0.71 |
| 8 | Arizona | 76.38 | 0.53 | 0.75 |
| 9 | Montana | 71.68 | 1.03 | 0.57 |
| 10 | South Carolina | 71.14 | 0.64 | 0.43 |
Top 5 States With the Worst Drivers
1. Texas
Texas’ score: 100 out of 100
- Texas is the second worst state in the country for two of the factors we examined: fatal car accidents involving a drowsy driver (1.35 accidents per 100,000 licensed drivers) and fatal car accidents involving a driver who was driving the wrong way on a one-way street or on the wrong side of the road (1.53 accidents per 100,000 licensed drivers).
- Texas also has the third highest rate of drunk drivers involved in fatal crashes, at 17.24 per 100,000 licensed drivers.
- Texas has the ninth highest number of fatal car accidents involving a distracted driver (1.92 accidents per 100,000 licensed drivers).
2. Louisiana
Louisiana’s score: 89.32 out of 100
- Louisiana ranks third in the nation for fatal car accidents caused by distracted drivers, with 3.74 accidents per 100,000 licensed drivers, and eighth for drunk drivers involved in fatal crashes, with 13.44 per 100,000 licensed drivers.
- Louisiana reports the 10th highest number of fatal car accidents involving a drowsy driver (0.9 accidents per 100,000 licensed drivers).
3. Kansas
Kansas’ score: 84.79 out of 100
- Kansas has the second highest number of fatal car accidents involving a distracted driver (4.46 accidents per 100,000 licensed drivers).
- The state has the third highest number of fatal car accidents involving a driver who disobeyed traffic signs, traffic signals or a traffic officer (1.47 accidents per 100,000 licensed drivers).
- Kansas is the fourth worst state for fatal car accidents involving a drowsy driver (1.28 accidents per 100,000 licensed drivers) and fifth worst for fatal car accidents involving a driver who was driving the wrong way on a one-way street or on the wrong side of the road (1.42 accidents per 100,000 licensed drivers).
4. Oklahoma
Oklahoma’s score: 80.53 out of 100
- Oklahoma has the seventh highest number of fatal car accidents involving a distracted driver (2.02 accidents per 100,000 licensed drivers).
- Oklahoma reports the eighth highest number of fatal car accidents involving a driver who failed to obey traffic signs or a traffic officer (1.27 accidents per 100,000 licensed drivers).
- The state is the ninth worst for drunk drivers involved in fatal crashes (13.02 drunk drivers were involved in a fatal collision per 100,000 licensed drivers).
5. Kentucky
Kentucky’s score: 78.96 out of 100
- Kentucky has the fourth highest number of fatal car accidents involving a distracted driver (3.37 accidents per 100,000 licensed drivers).
- Kentucky reports the eighth highest number of fatal car accidents involving a drowsy driver (0.93 accidents per 100,000 licensed drivers).
- The state also has the ninth highest number of fatal car accidents involving a driver who was driving the wrong way on a one-way street or on the wrong side of the road (0.74 accidents per 100,000 licensed drivers).
Most And Least Expensive Vehicles To Insure
Gap Insurance 2025 What Is Gap Insurance?
The General Car Insurance Review
Study Methodology
Forbes Advisor compared all 50 states and Washington, D.C., across six metrics to identify the states with the worst drivers.
- Number of drunk drivers (BAC of 0.08+) involved in fatal car accidents per 100,000 licensed drivers: 18% of score. Data comes from the National Highway Traffic Safety Administration. We took a three-year average from 2018 to 2020.
- Number of fatal car accidents involving a distracted driver per 100,000 licensed drivers: 18% of score. This metric includes various forms of distracted driving, such as looking at a phone, talking and eating. Data comes from the National Highway Traffic Safety Administration. We took a three-year average from 2018 to 2020.
- Number of fatal car accidents involving a drowsy driver per 100,000 licensed drivers: 18% of score.This metric includes fatal car crashes involving drivers who are drowsy, asleep, fatigued, ill or blacked out. Data comes from the National Highway Traffic Safety Administration. We took a three-year average from 2018 to 2020.
- Number of fatal car accidents involving a driver who was driving the wrong way on a one-way street or on the wrong side of the road per 100,000 licensed drivers: 18% of score. Data comes from the National Highway Traffic Safety Administration. We took a three-year average from 2018 to 2020.
- Number of fatal car accidents involving a driver who failed to obey traffic signs, traffic signals or a traffic officer per 100,000 licensed drivers: 18% of score. Data comes from the National Highway Traffic Safety Administration. We took a three-year average from 2018 to 2020.
- Number of drivers who looked at a phone per mile: 10% of score. This metric includes the number of drivers who looked at a phone per mile, relative to the countrywide average, including texting, touching the phone to make or receive calls, and other activities that required drivers to physically interact with their phones. Data comes from Arity, a mobility data and analytics company, 2023.
States With The Worst Drivers 2025 Faqs
What state is best driver?
- 5 states with best drivers. According to our survey data, these are the five states with the best driving behavior and least amount of aggressive driving.
- Tennessee. Tennessee wins the crown of having the best drivers based on our survey data. …
- Oregon.
- Arizona (tied)
- Florida (tied)
- Washington.
Which state has the least aggressive drivers?
According to The Latest surveyed 10,000 licensed US drivers on their behaviour behind the wheel, and ranked the 50 states based on which were home to the most confrontational motorists. Key Findings: In 2023, Arizona is home to the angriest drivers in the country, while Delaware has the most polite motorists overall.
Which state has safest drivers?
New Jersey is the safest state for drivers, with fewer fatal accidents and fewer fatalities from speeding and impaired driving. Idaho experienced the most significant increase in car accident fatalities at 27%, while Wyoming experienced the largest decrease in fatalities at -13%
Who is the safest driver?
In sum, “older drivers” in their 60’s are the safest drivers on the road. Older drivers up to 75 are only slightly riskier.
Which age is best for driving?
Most youth are eager to drive at the earliest possible age because driving means fun and freedom. As parents, we’re more concerned about keeping them safe. We know the human brain doesn’t fully mature until 25 and studies show 16 and 17 year-olds are much more likely to crash than 18 year-olds.
What states drive the fastest?
It may come as no surprise that Texas retains its title as the speediest state, as it continues to lay claim to the nation’s highest speed limit: 85 mph.


